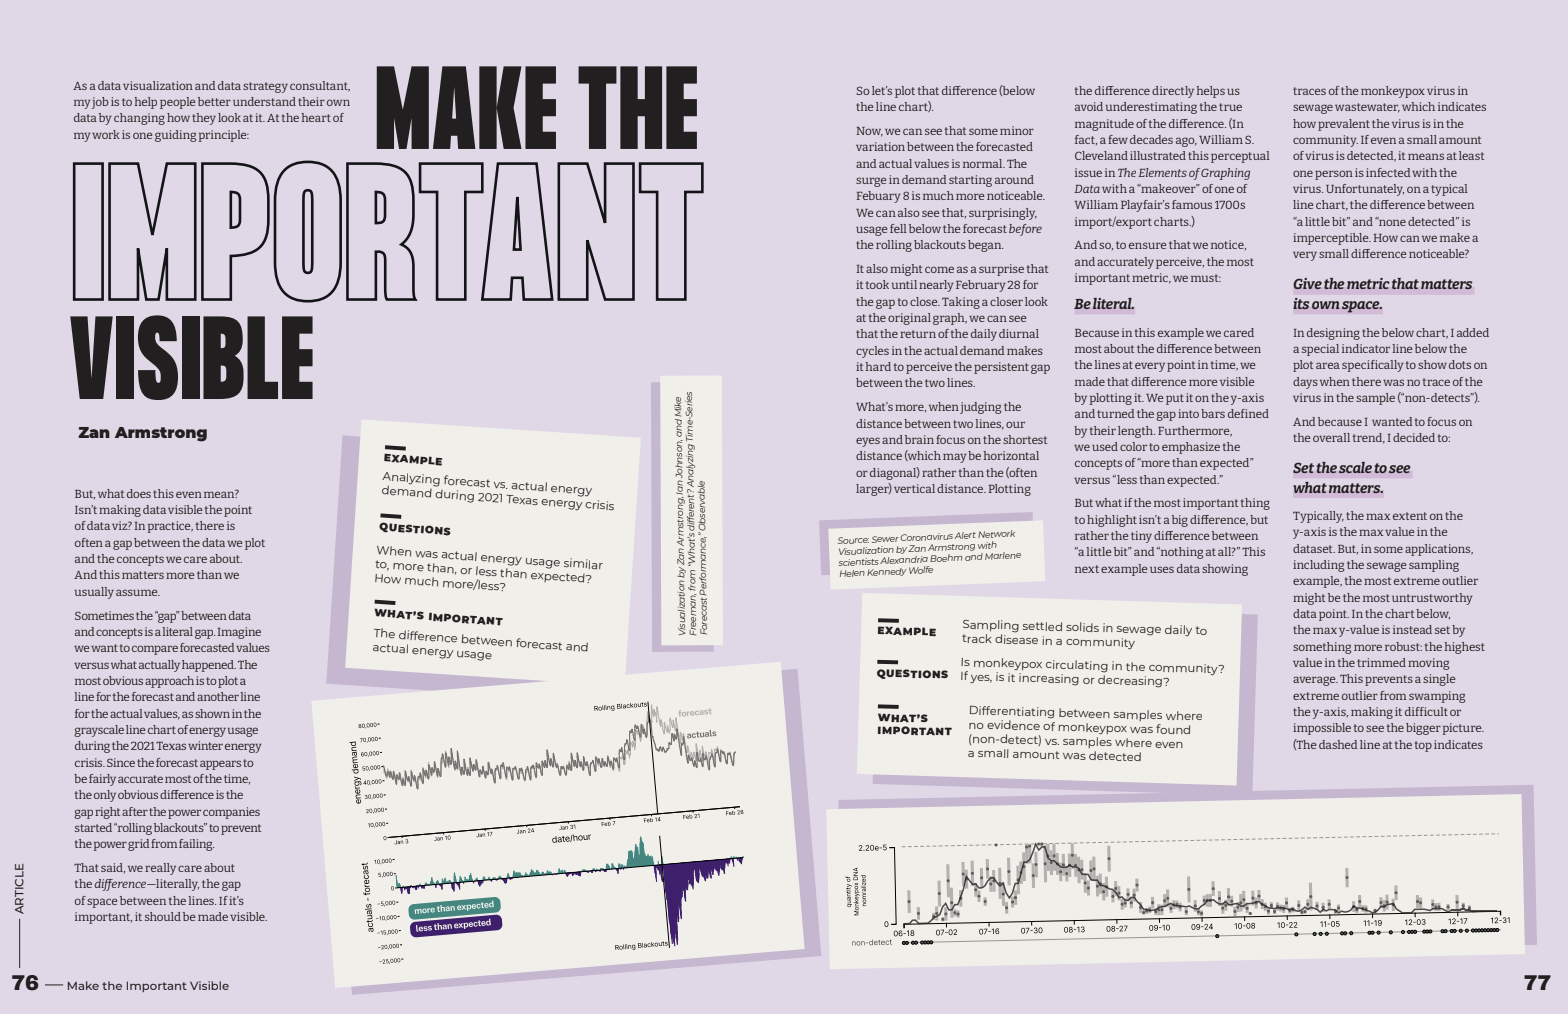
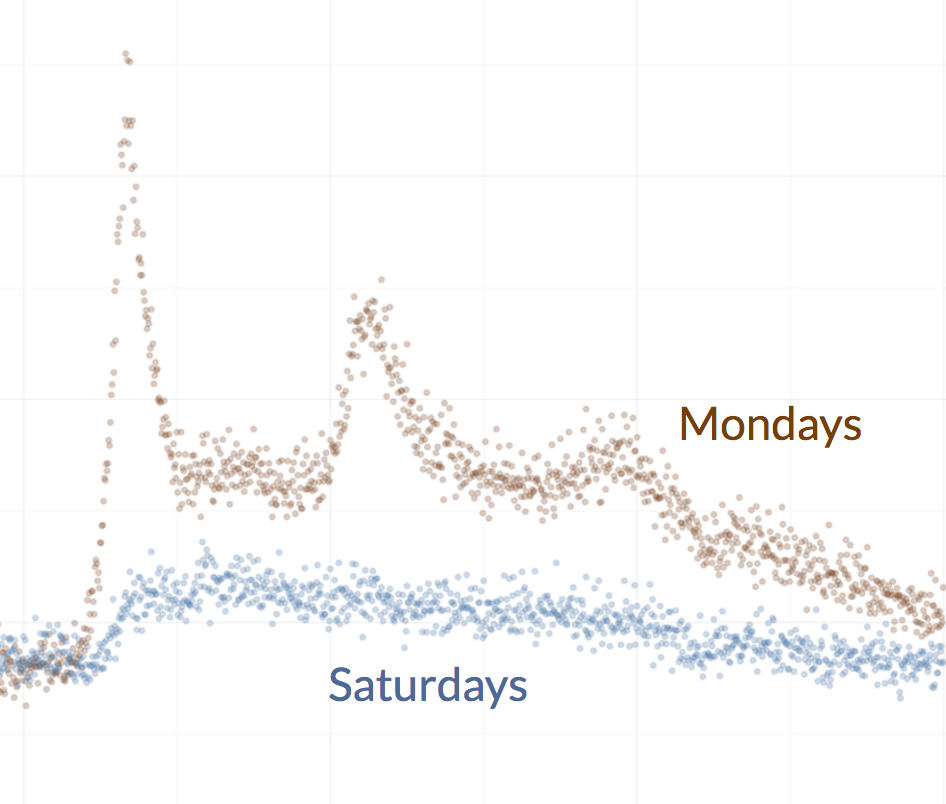
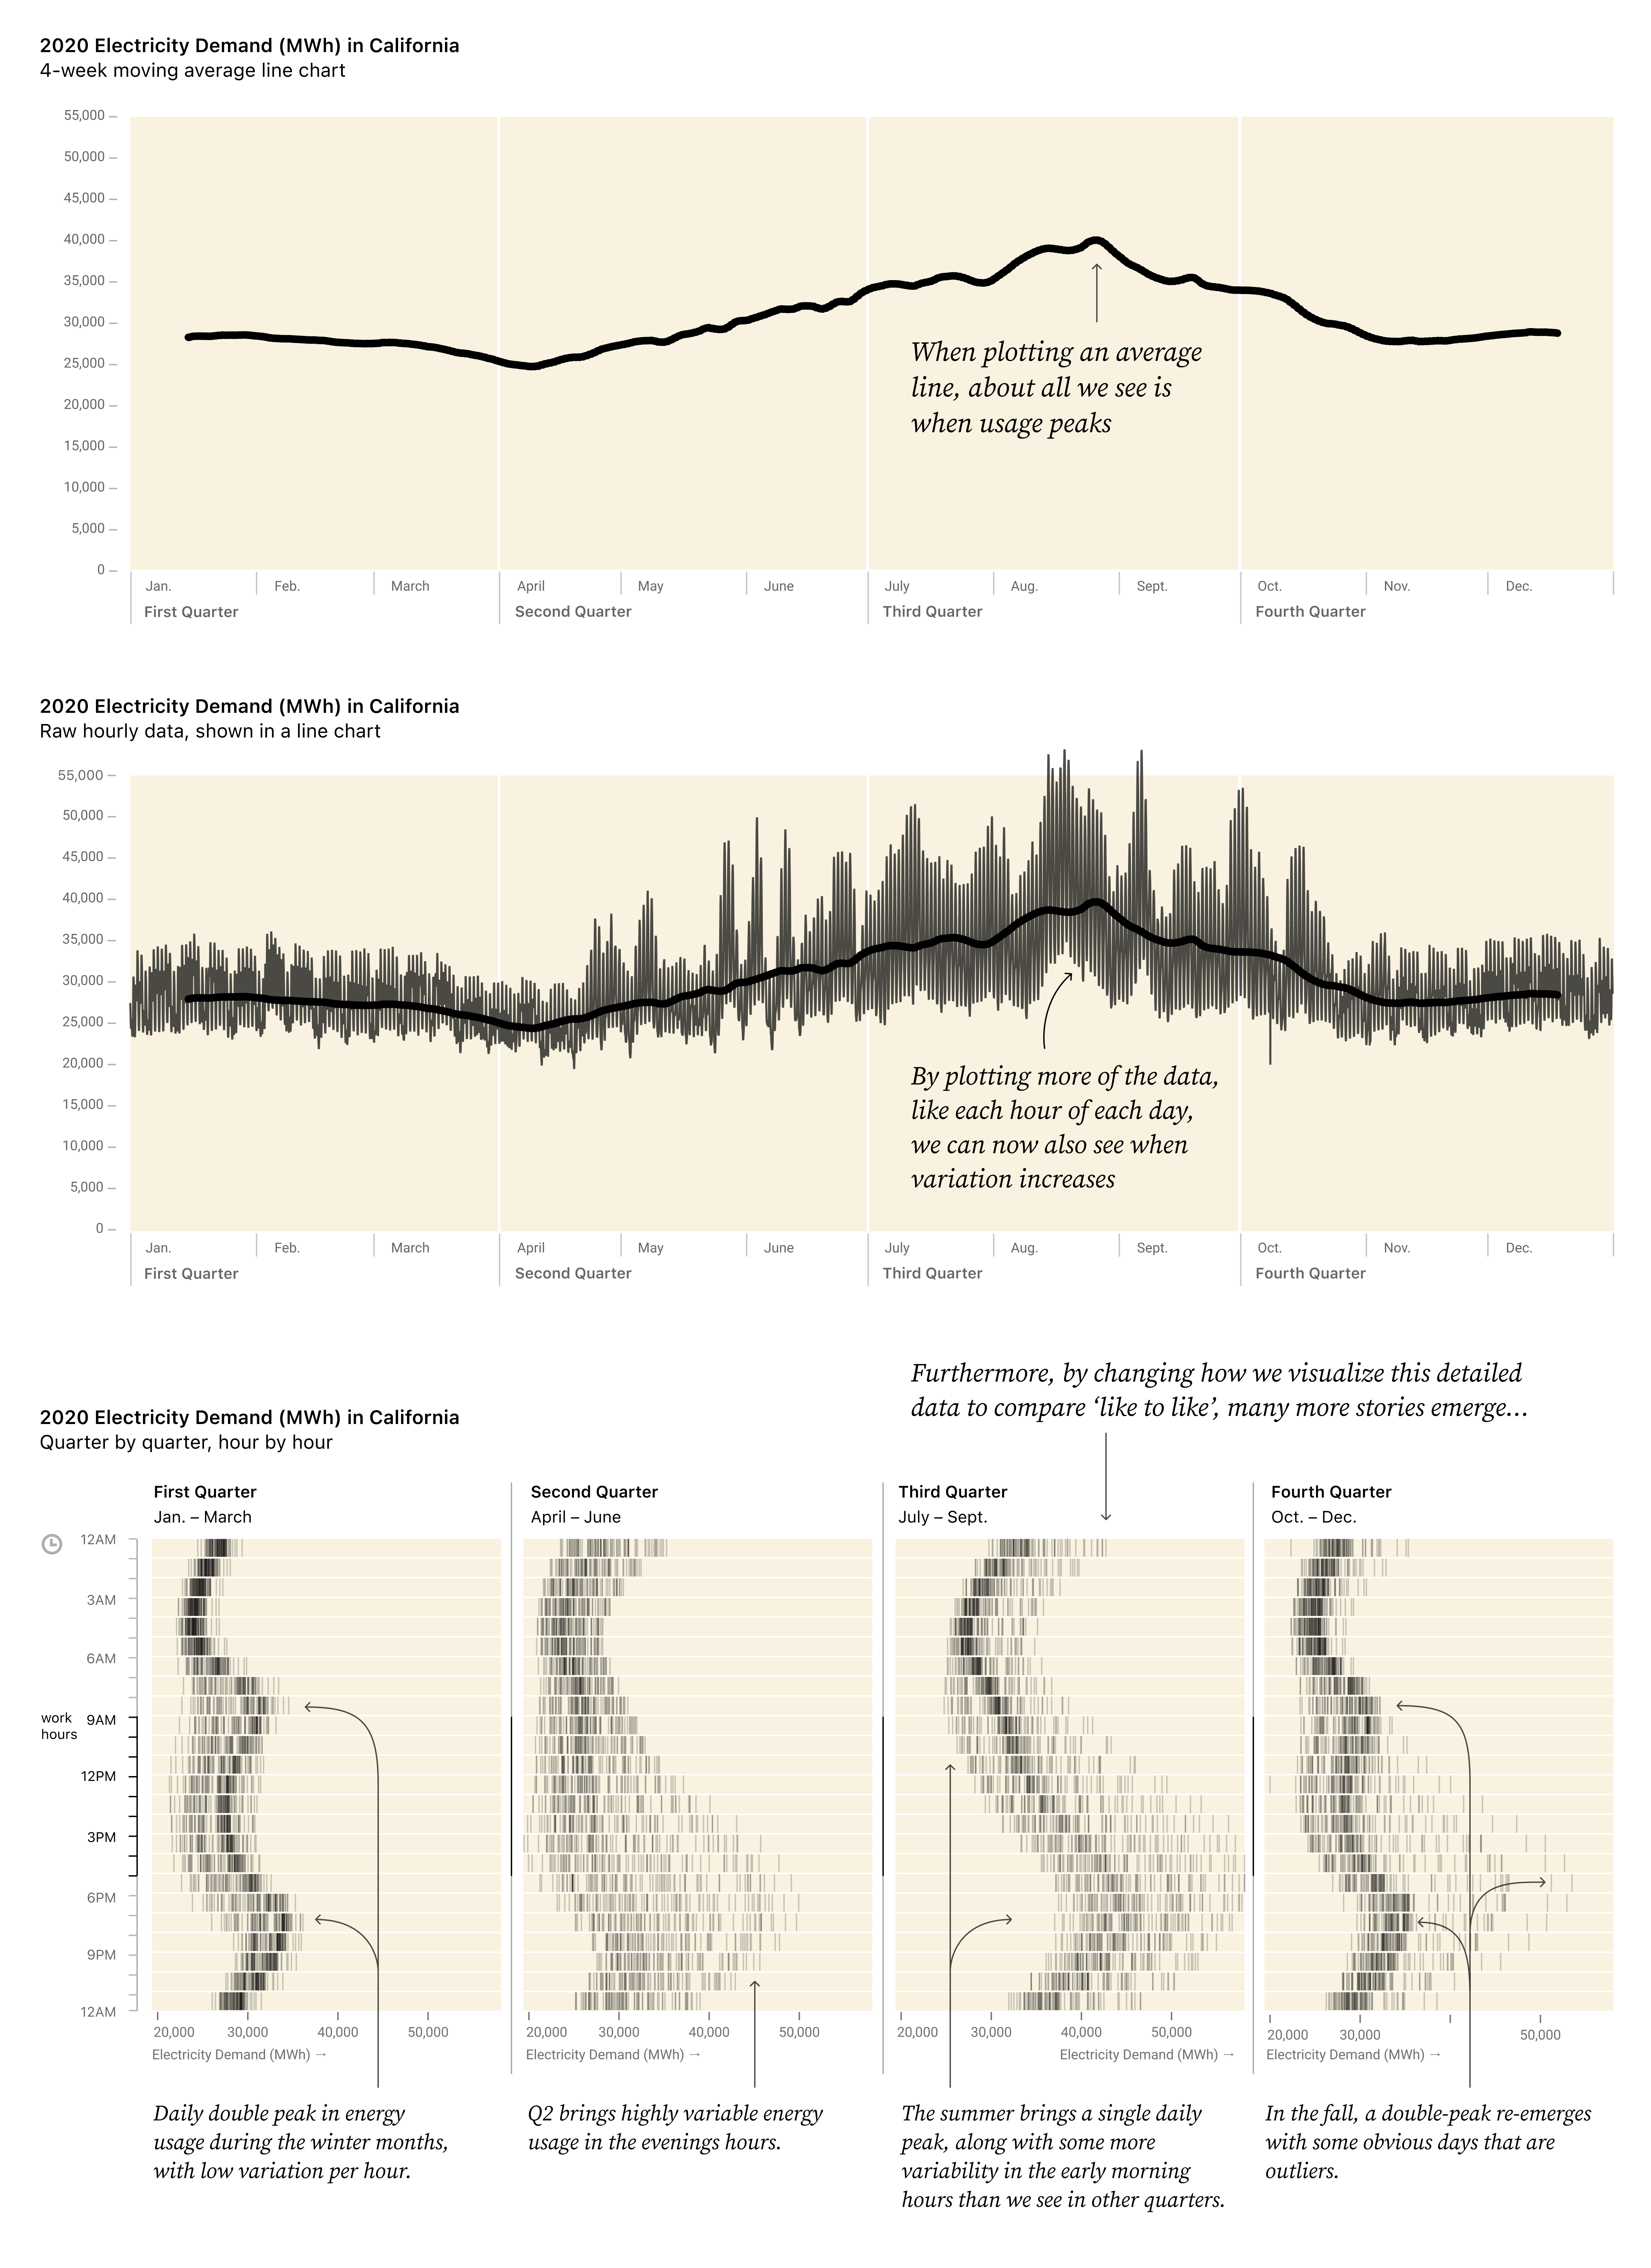
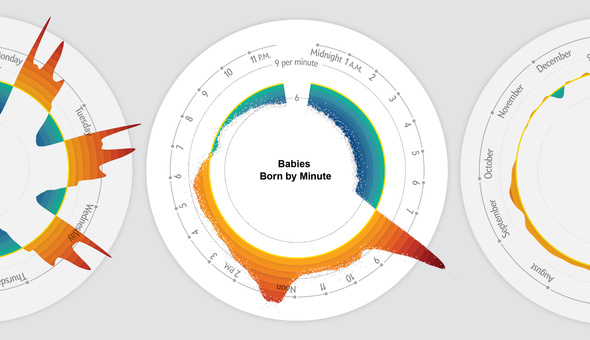
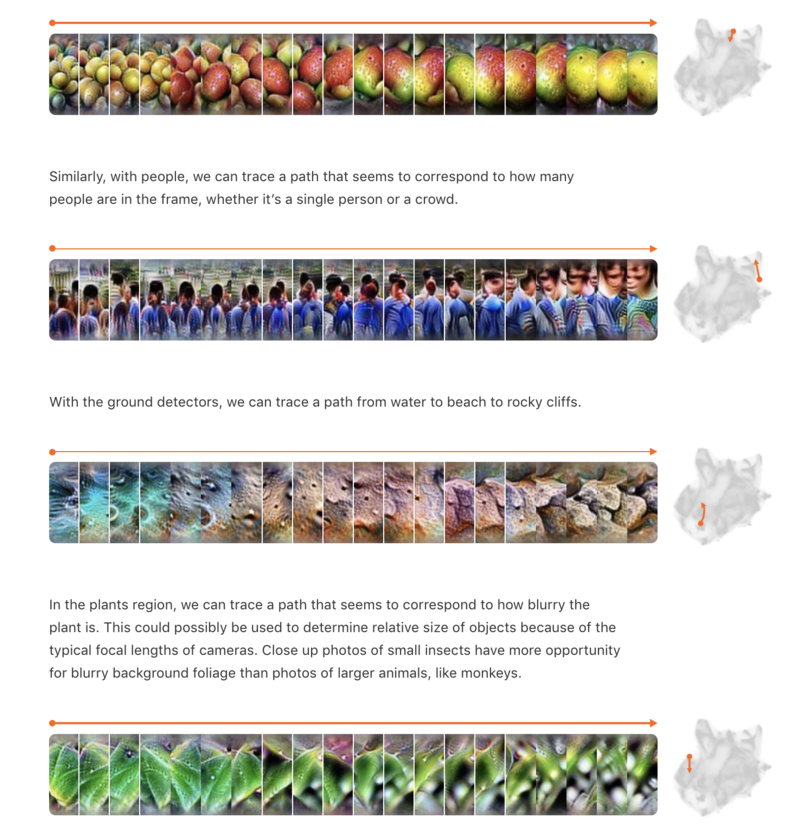
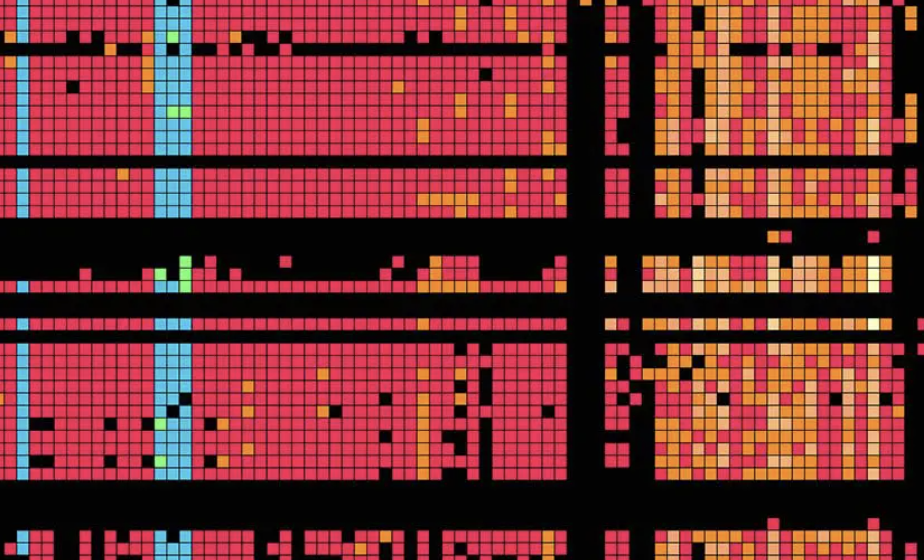
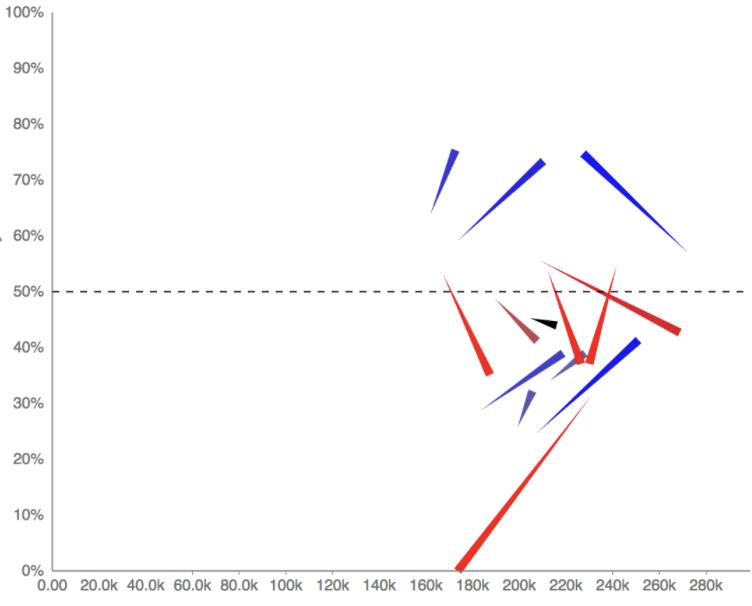
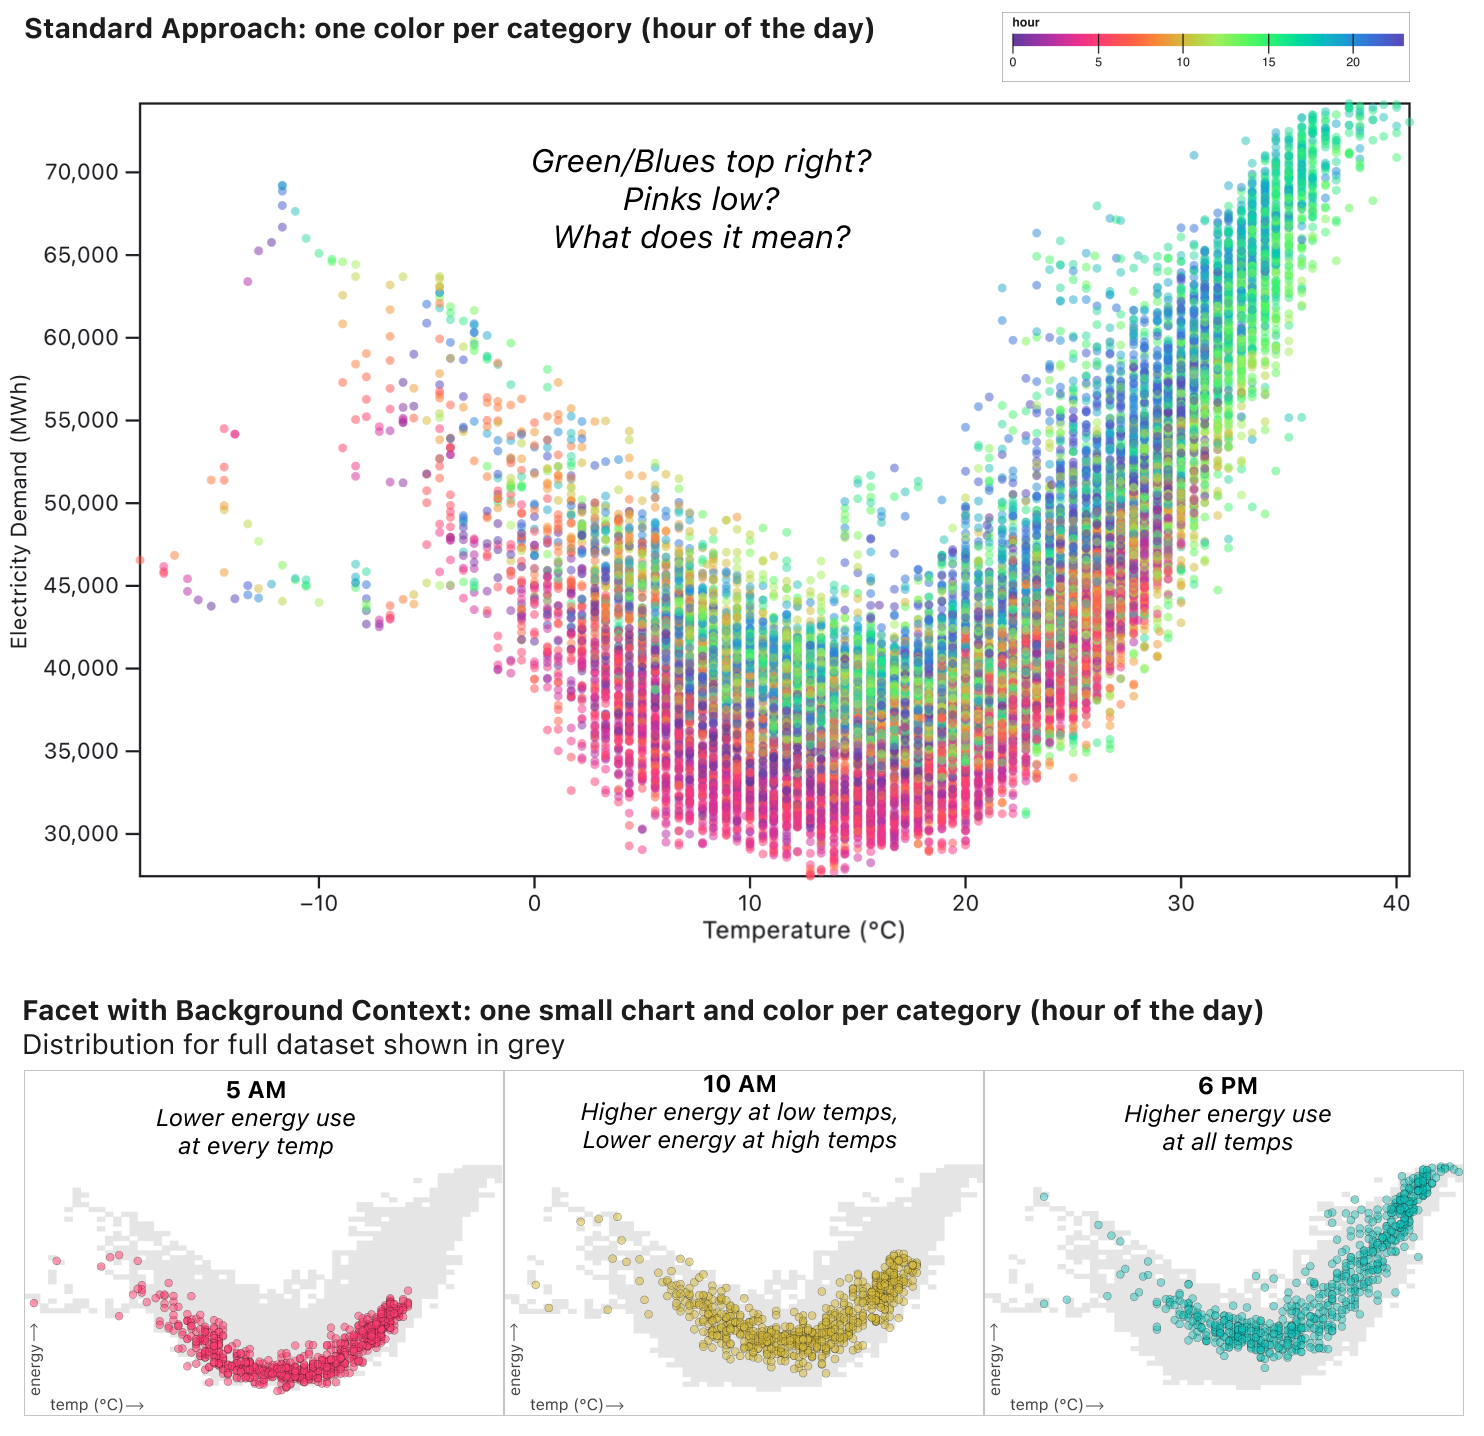
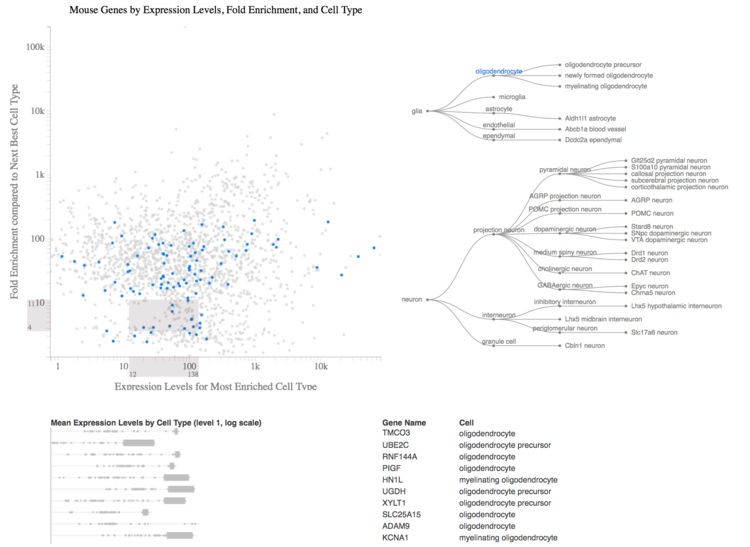
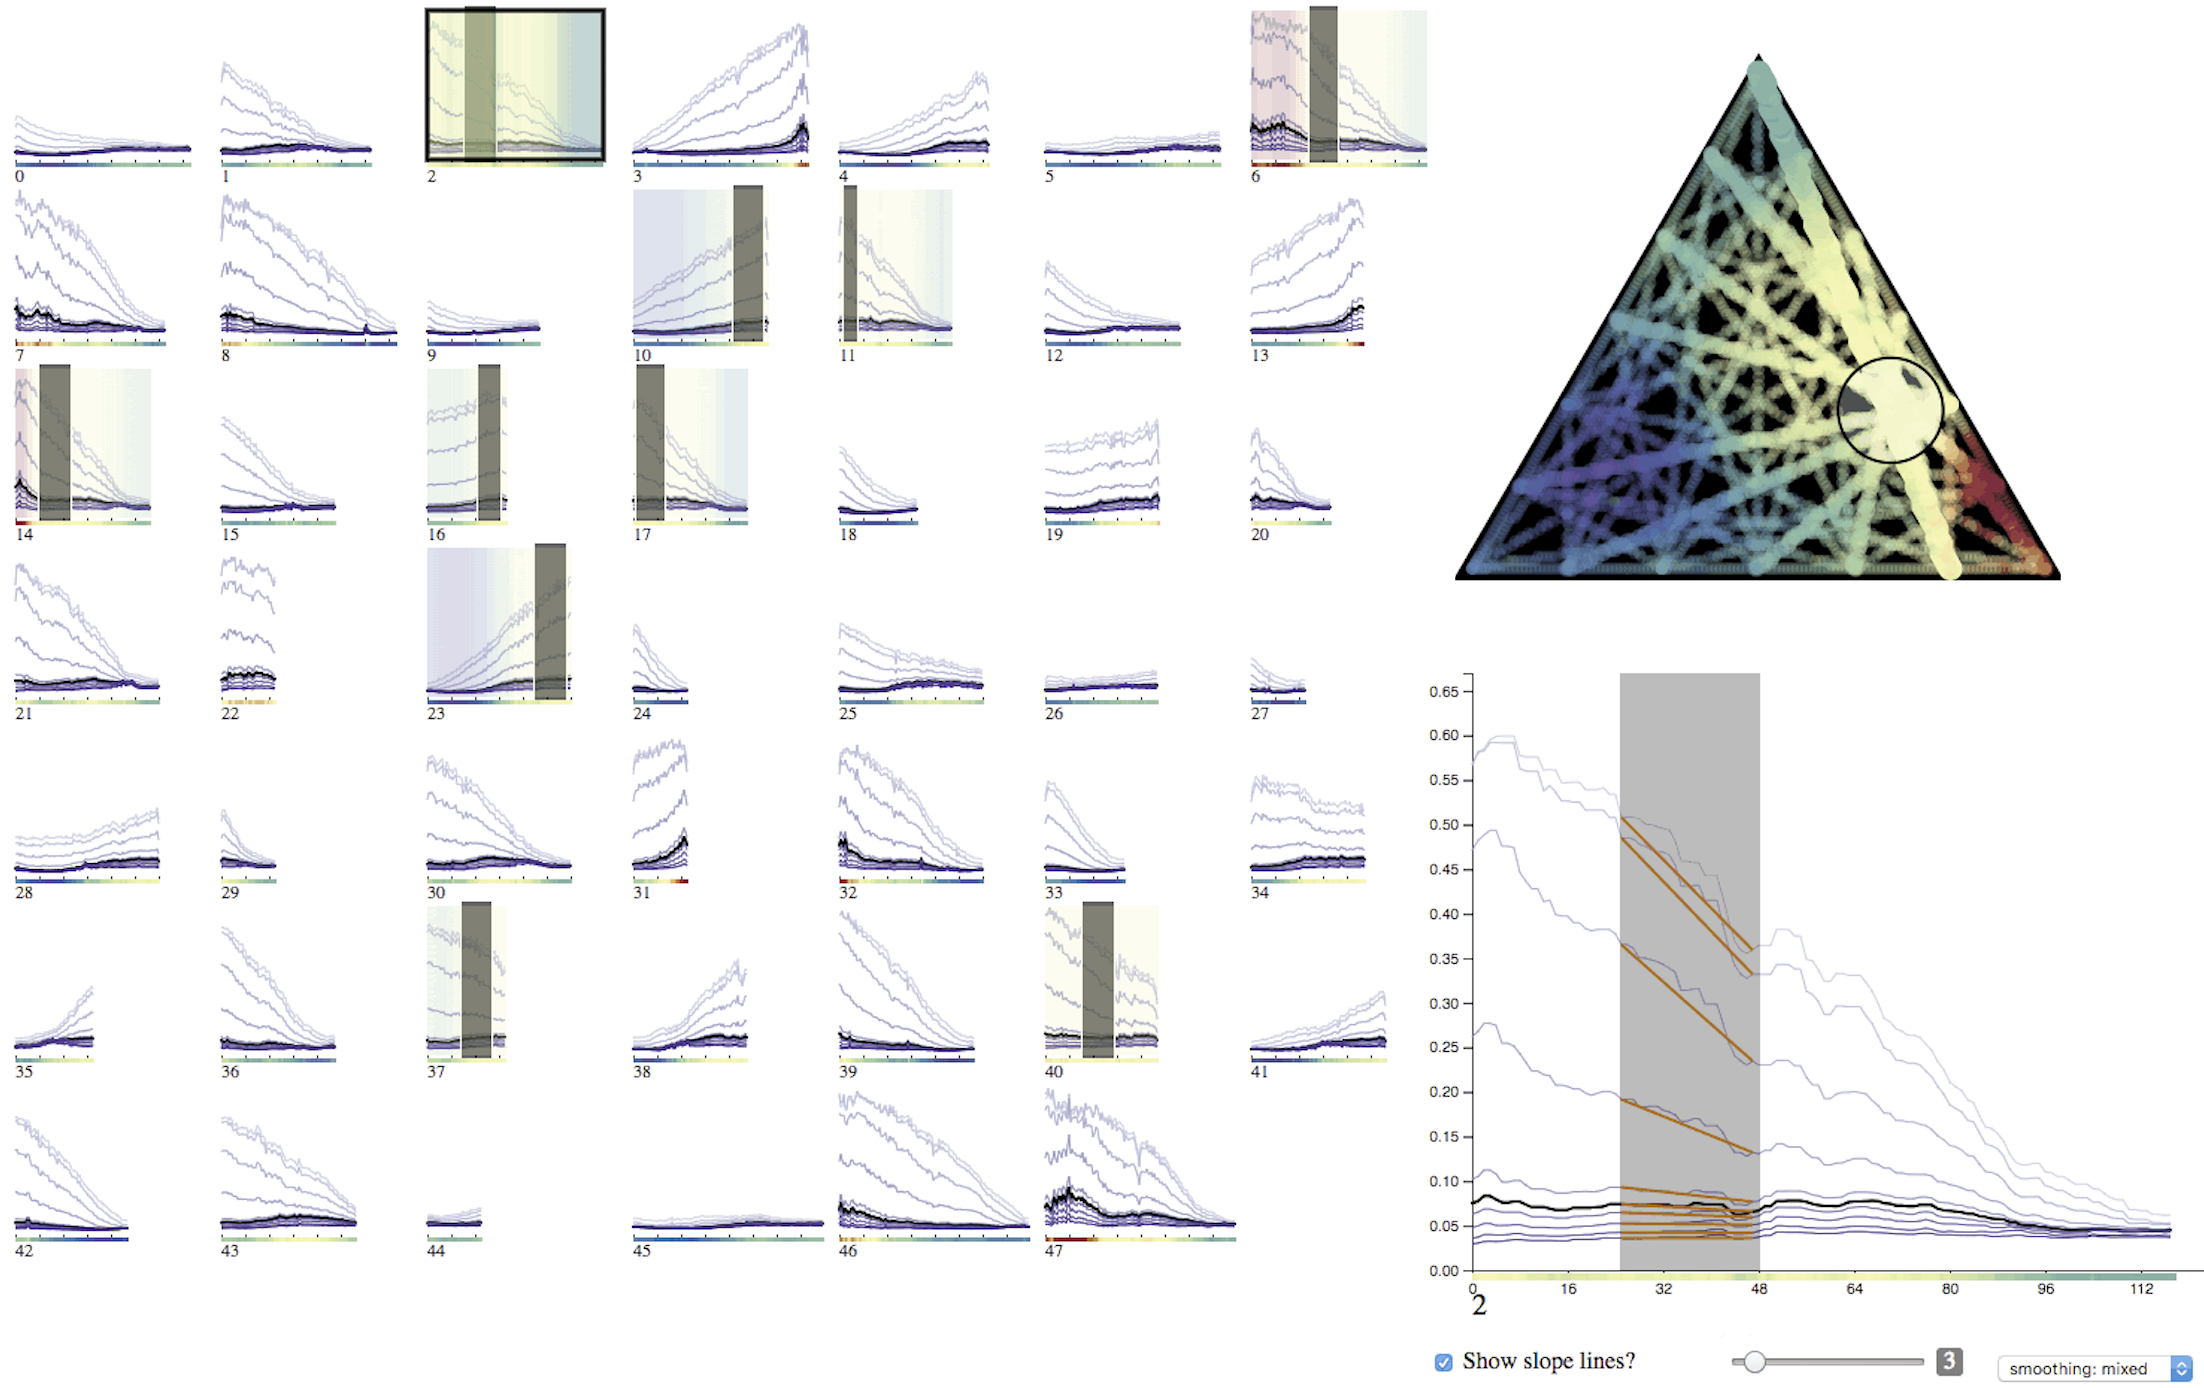
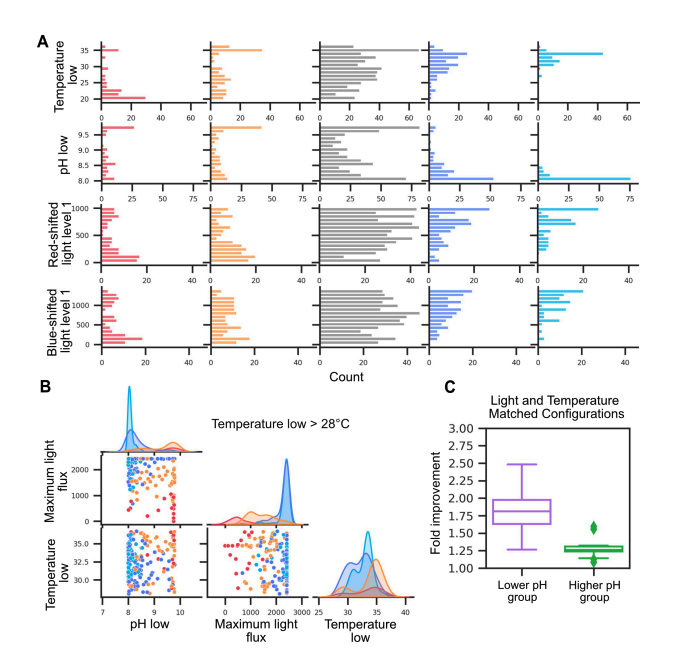
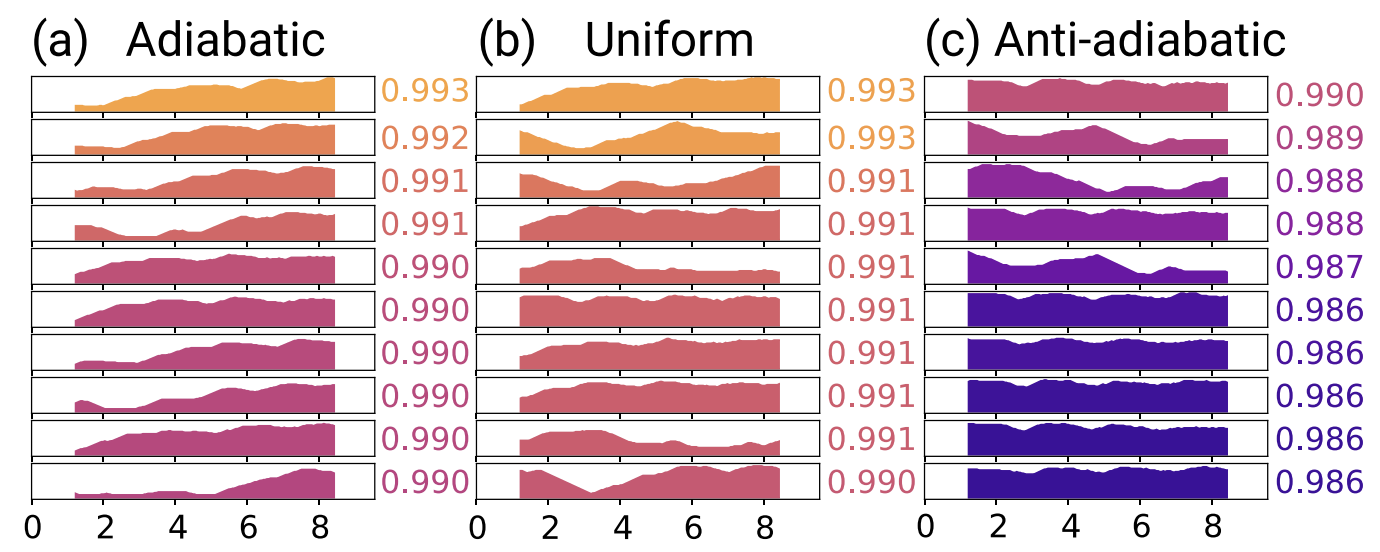
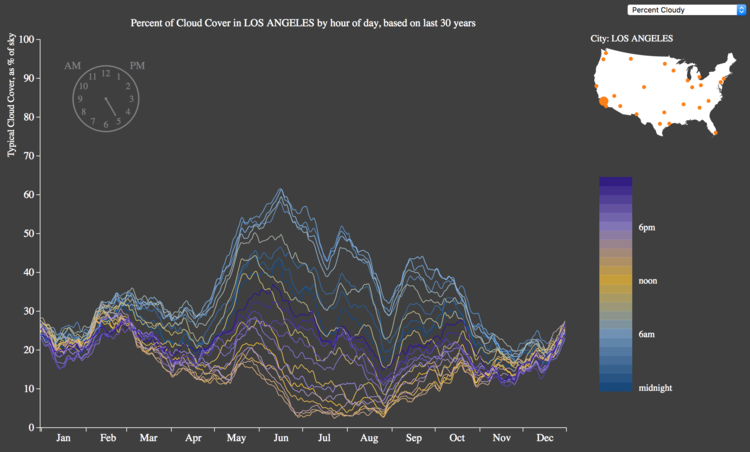
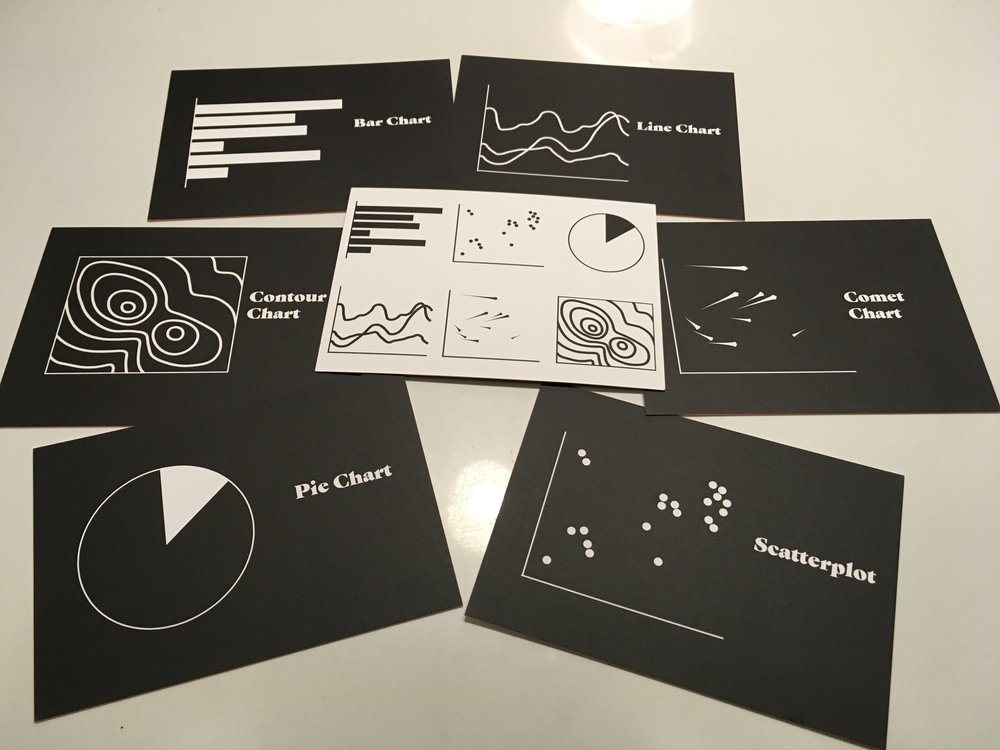
I create charts and graphs which change how people look at their data (literally) -- leading to better decision making, data driven questions, deeper understanding, and new discoveries.
I've worked with companies from early-stage startups to big tech, and created visualizations used by Google's Applied Science researchers, Yale, Stanford, UC Berkeley, Scientific American, National Geographic, the Dalai Lama, CDC, the White House.
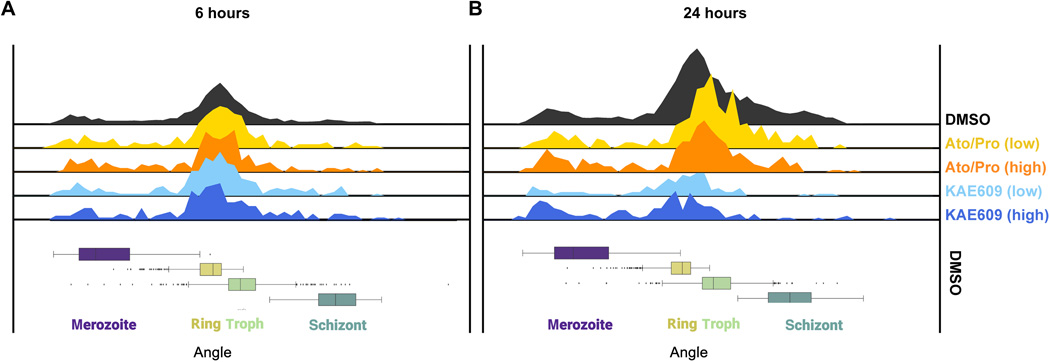
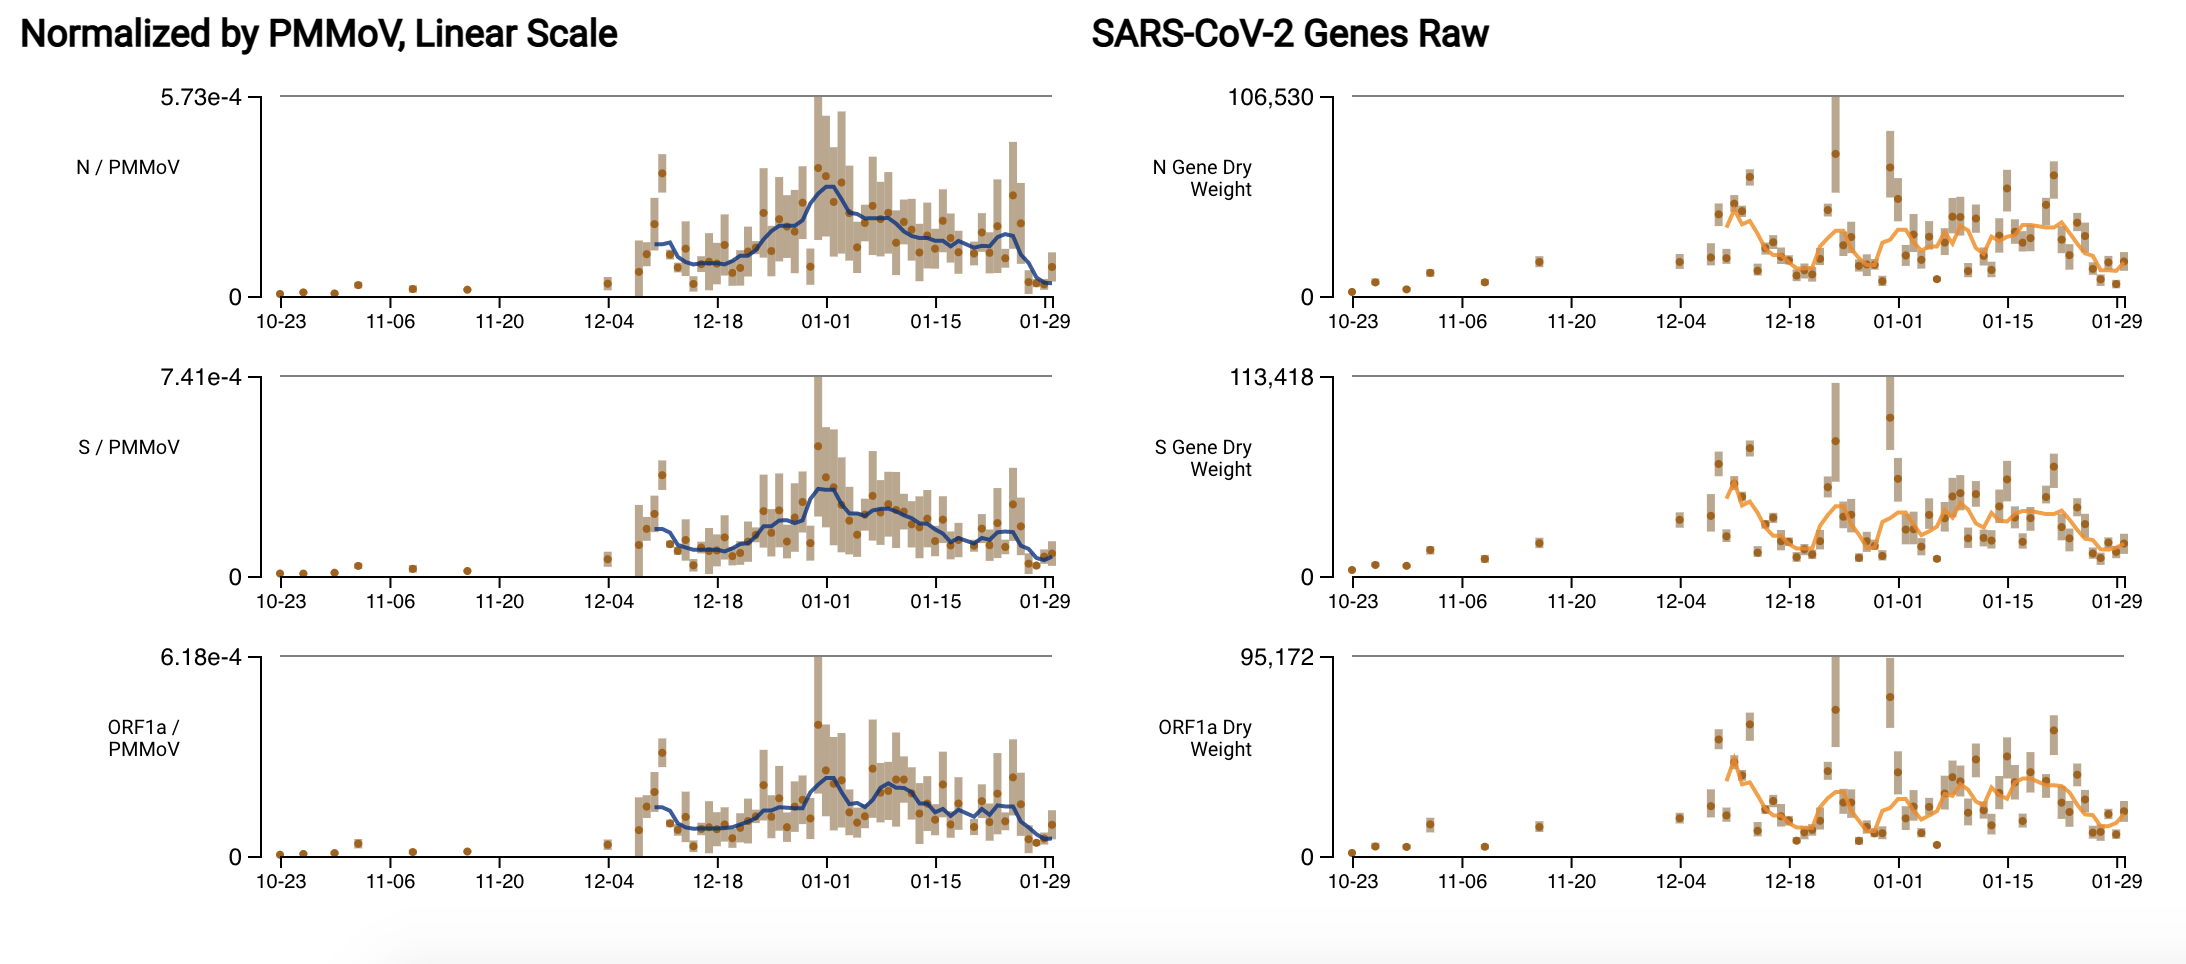
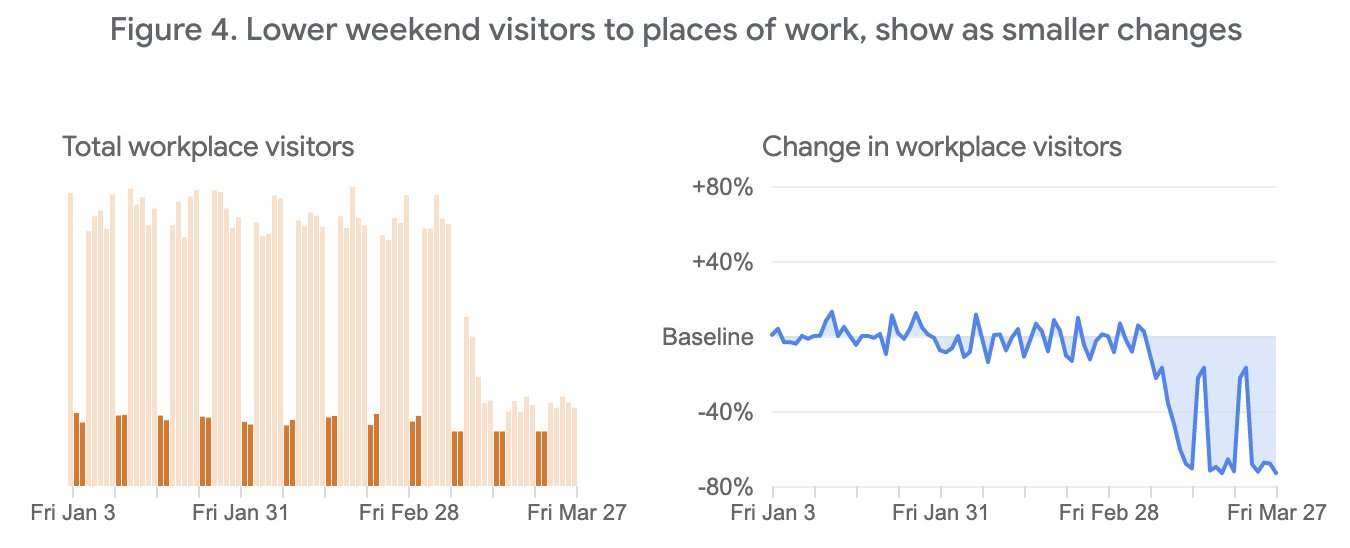
My work spans analytical challenges across industries and sectors. I've helped research teams building large-scale computing and ML systems, contributed to scientific discoveries, guided decisions made by senior executives at both start-ups and Google, informed public health officials and scientists tracking emerging pathogens through wastewater data, and helped the Google Search team make data related to COVID-19 accessible to millions of people. My work has been recognized beyond their analytical origins; visualizations originally created to understand bacterial life or AI models have been exhibited at major museums including SF MOMA, Ars Electronica, and Cooper Hewitt.
I've shared my expertise through teaching Design of Data at Stanford's d.school, publishing viz research, mentoring the data viz specialist at the ACLU, writing articles, and speaking at conferences including OpenVisConf, Outlier, Rice University's Visual Communication Symposium, keynote at Google's quant UX conference, SciPy, JSM (Joint Statistical Meeting), and IEEE Viz.
My perspective in data visualization is grounded in my experience as a data analyst, especially in my work forecasting/analyzing revenue data and advising executive stakeholders as a Senior Financial Analyst at Google.
